
Goal
To determine the value of k, the coefficient of air resistance, using a computer model and experimental data.
Theory
The trajectory of an object can be precisely calculated using a set of kinematic equations that are based on a few initial values and constants. In two dimensions, the X and Y values can be summed up with the following equations:
![]()
Without air resistance, the only force acting on the projectile is gravity, which is constant. However, the presence of air (or any fluid medium) introduces a varying ‘drag’ force. This force acts in the opposite direction of motion and is proportional to the velocity of the projectile.
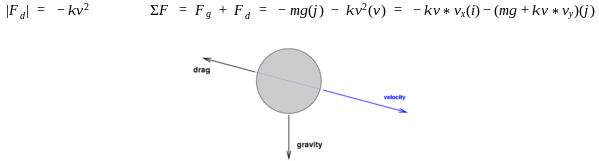
The net force has components in both (x and y) directions while the magnitude depends on velocity. Using Newton’s 2nd law, (F=ma), the resulting acceleration can be described by:
![]()
To calculate the trajectory, we must revise the kinematic equations to factor in a varying acceleration. Since this requires tricky integrations, we will resort to using Euler’s numerical method.
To apply Euler’s method, we must compute the kinematic values at very small time intervals and make the assumption that during this interval, acceleration is constant.
Euler’s Method
- Define variables (x, y, v, vx, vy, ax, ay, g, m, d, theta, dt, t, k,)
- Use the initial conditions and kinematic equations to compute values of vx, vy, x, and y during the first iteration.
- Compute new acceleration and the previous values over the next iteration.
- Repeat this loop over a set time.
Experiment
This experiment consists of two parts. The first part is to develop a computer model that calculates the trajectory of a projectile given some value of k (air resistance). The second part is to conduct a physical experiment where we can measure the flight time of a trajectory.
Part One: Creating a Computer Model
Our computer model is used to determine the trajectory of a projectile which varies based on a value of k. The value of k can be adjusted until the path matches the data acquired from our physical experiment, thus revealing the actual value of k. The model is constructed by applying Euler’s method in javascript form. The javascript code for determining the coefficient of air resistance using Euler’s method is shown here:
var v=15;        var t=0;       var g=9.81;     var theta=45;

 var m=2;        var dt=0.01;    var k=0;

 var x=0;                        var y=0;

 var vx=v*cos(theta);            var vy=-v*sin(theta);

 var ax=(-k/m)*vx;                       var ay=g*(-k/m)*vy;
frameRate(1000);
var draw = function() {
fill(0,0,0); ellipse((x+1)*10,(y+10)*10,4,4);
if (t<2.3) {
ax=(-k/m)*vx; ay=g-((k/m)*vy);
vx=vx+(ax*dt); vy=vy+(ay*dt);
x=x+(vx*dt); y=y+(vy*dt);
t=t+dt;
}
println(“t = ” + t); println(“x = ” + x);
println(“y = ” + y); println(“vx = ” + vx); println(“vy = ” + vy);
println(“ax = ” + ax); println(“ay = ” + ay);
};
Part Two: Doing The Experiment
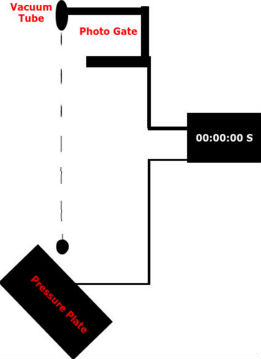
The vacuum tube holds the ball in place and releases it, triggering the photogate to start the timer and eventually triggering the pressure plate to stop the timer.
Equipment
Procedure
- Mount a photogate at the top of a stairwell.
- Place pressure plate at bottom of stairwell.
- Mount vacuum tube just above the photogate so that when the ball is attached it lies just above the photogate.
- Connect the photogate and pressure plate to a timer.
- Attach the ball to the vacuum.
- Release the ball, allowing it to trigger the photogate and pressure plate, recording the time of fall.
- Repeat this for 10 trials.
- Measure the distance of the fall and the diameter and weight of the ball.
Data & Results
| Trial | Time (s) | K (1e-03*) | K (theory*) | Kdev (1e-05*) |
| 1 | 1.6942 | 0.1211 | 0.1683 | |
| 2 | 1.6931 | 0.1183 | 0.1087 | |
| 3 | 1.6931 | 0.1183 | 0.1087 | |
| 4 | 1.6929 | 0.1179 | 0.1517 | |
| 5 | 1.6926 | 0.1170 | 0.2397 | |
| 6 | 1.6924 | 0.1166 | 0.2817 | |
| 7 | 1.6930 | 0.1181 | 0.1347 | |
| 8 | 1.6940 | 0.1207 | 0.1263 | |
| 9 | 1.6952 | 0.1239 | 0.4483 | |
| 10 | 1.6946 | 0.1222 | 0.2823 | |
| AVG | 1.69351 | 0.1942 | 0.1419 | 0.2278 |
- Mass(ball) = 0.00968 kg
- Diameter(ball) = 0.0254 m
- Distance = 13.32865 m
- K = Kavg ± Kavgdev = 0.0001942 ± 0.0000023
- Percent Difference = 26.93%
Conclusion
The experimental value of k compared to the theoretical value is off by roughly 27%. This is a significant enough discrepancy to suggest some flaws or error in the experiment. There are a few factors that may have been a source of error.
Air Currents: Due to people opening and closing doors as well as a heater running in the stairwell, there may have been some updrafts affecting the flight of the ball. If an updraft occurred during the ball’s drop then the effective velocity would have been increased, therefore increasing the drag force and altering our determination of K.
Ball Spin: Control over the spin of the ball was limited. Any type of rotation could cause a mild ‘magnus effect’. This could slow down the descent of the ball.
Overall, this experiment exemplified an effective way to determine the coefficient of air resistance. With a few small adjustments to the experiment we could easily negate the original sources of error and obtain a more accurate value of K.